Monday, 6 May 2024

Mastering the Art of Graphing: A Step-by-Step Guide

Drawing graphs is essential in educational and professional settings, as it helps communicate information clearly and efficiently. Whether you're a student, a scientist, or just looking to present data compellingly, knowing how to create an effective graph is invaluable. Here’s a guide to help you draw graphs that are not only informative but also visually appealing.

1. Utilise Your Graph Paper Fully

The first step in drawing a graph is to make the best use of the available space on your graph paper. Avoid cramming all data into one corner; instead, spread out your data across the graph. This approach helps in better visualisation and interpretation later on.

2. Tools of the Trade

Always use a sharp pencil to mark points and draw lines. This ensures precision in your work, making your graph more readable and professional.

3. Plotting Your Points

Begin by placing your data points on the graph. Be precise and ensure each point is placed correctly according to the values it represents. This accuracy is crucial for the reliability of your graph.

4. Deciding on the Line of Best Fit

Once your points are plotted, decide whether to connect the dots directly or to use a line of best fit. If you opt for a line of best fit, ensure it appropriately represents the trend in your data, with the points evenly distributed around the line.

5. Drawing Lines

Whether connecting points directly or drawing a line of best fit, use a ruler to keep your lines straight and neat. For curves, maintain a smooth, consistent shape.

6. Labelling is Key

Clearly label your axes and include units of measurement. This step is crucial as it provides context to your data, making the graph informative and easy to understand. Remember to label both the x-axis and y-axis accurately. Don't forget the units.

7. Title Your Graph

Always give your graph a descriptive title that captures the essence of the data it represents. A well-chosen title can effectively communicate the purpose of the graph at a glance.

8. Setting Up Axes

Select sensible ranges for your axes to avoid data clustering that can occur if the ranges are too narrow. Proper scaling enhances the graph's clarity and makes it easier to interpret the data.

9. Interpreting Data

For instance, plotting a standard curve for protein concentration against absorbance, start with known concentrations on the x-axis and absorbance on the y-axis. Adjust the axis range to ensure all points are visible and not squished at the bottom.

10. Calculating and Using the Gradient

Once your graph is complete if you need to calculate the gradient of a straight line, draw the largest possible triangle under the line and use the formula (rise/run). This gradient could represent a specific value of interest, such as an extinction coefficient in spectrophotometry.

11. Dealing with Multiple Data Sets

If your graph contains multiple data sets, differentiate each set using various styles of points and lines. This distinction makes it easier to compare and contrast the data sets visually.

12. Avoid Extrapolation

Never extrapolate your data beyond the measured range. Doing so can lead to inaccurate conclusions. For data points that exceed the range of your graph, note that these values are beyond measured limits.

Final Thoughts

Graphing doesn't have to be daunting. With the right tools and a careful approach, anyone can create clear, informative, and visually appealing graphs. Remember, a good graph tells a story that speaks with clarity and impact.

If you would like to support my blogging efforts, then please feel free to buy me a coffee at https://www.buymeacoffee.com/drnickm

Blog Bonus: Free information sheet summarising the video and defining the key terms - download.

Additional Resources


New video posted: Embryonic Development: How the Frog Xenopus Sets the Stage for Life

In this video, I discuss embryonic development, a fascinating journey that can be studied in detail using the African clawed frog (Xenopus laevis) as a model organism. 

The frog oocyte (egg) is asymmetrical, with a pigmented upper half (animal pole) and a white lower half (vegetal pole), which contains most of the yolk. Development occurs outside the body of the frog and this makes it ideal for studying development.

The video covers fertilisation and the 30-degree rotation of the oocyte's cortex to form the "grey crescent" that determines the future dorsal side (back) of the embryo. This rotation begins the transformation into a three-dimensional body plan with three lines of asymmetry: left-right, anterior-posterior (top-bottom), and dorsal-ventral (back-front). 

The video also looks at the formation of the blastula, a hollow ball of about 4,000 cells. The subsequent gastrulation process establishes three germ layers:

  1. Mesoderm: Forms muscles, bones, and cartilage.
  2. Ectoderm: Develops into nerve tissue and the epidermis.
  3. Endoderm: Creates the gut lining and related structures.

The localisation of key messenger RNAs like VegT and Wnt11 and the mapping studies which determined the fate of cells in the mature frog.

If you would like to support my blogging efforts, then please feel free to buy me a coffee at https://www.buymeacoffee.com/drnickm

Blog Bonus: Free information sheet summarising the video and defining the key terms - download.
 

Additional Reading

The video was produced with help from the following resources:

New video posted: An Introduction to Cell Differentiation and Embryonic Development

In this video, I look at how, after the haploid sperm fuses with the haploid oocyte to form a zygote, we go from one diploid cell to over 200 different cell types and 3 times 10 to the power of 13 (3 with 13 zeros after it) cells. That is a lot of cells and the process is called cellular differentiation.

If you would like to support my blogging efforts, then please feel free to buy me a coffee at https://www.buymeacoffee.com/drnickm

Blog Bonus: Free information sheet summarising the video and defining the key terms - download.
 

Additional Reading

The video was produced with help from the following resources:

Friday, 3 May 2024

DNA - that's a wrap - 14 DNA revision videos

OK, so that is a wrap on DNA, a topic of immense significance in the world of biology and genetics.

Over the past few weeks, I have released fourteen revision videos on DNA, with accompanying posts on here and with information sheets accompanying each video (you can find a link to the information sheets in the links below).

In the videos, I have covered:

I then moved on to the all-important three Rs of DNA - replication (copy), repair and recombination:
Next, I asked the important question of how cells regulate the processes of transcription and translation:
I finished off the series by looking at some lab techniques we use to work with DNA:

If you would like to support my blogging efforts, then please feel free to buy me a coffee at https://www.buymeacoffee.com/drnickm


Additional Reading

The video was produced with help from the following resources:

New video posted: Understanding Nucleic Acid Hybridisation: Methods & Applications Explained

In this video, I look at Nucleic Acid Hybridisation and how it is the underlying principle for several lab techniques, such as PCR (Polymerase Chain Reaction), dot blots, colony blot hybridisation, chromosome in situ hybridisation (FISH), microarrays, Southern and Northern blotting, and CRISPR/Cas9 gene editing.

If you would like to support my blogging efforts, then please feel free to buy me a coffee at https://www.buymeacoffee.com/drnickm

Blog Bonus: Free information sheet summarising the video and defining the key terms - download.
 

Additional Reading

The video was produced with help from the following resources:

A Comprehensive Guide on How to Calculate the Size of a DNA Band on a Gel

How do scientists determine the size of DNA bands on an agarose gel? In this guide, I will walk you through the step-by-step process of calculating the size in base pairs of a DNA band on an agarose gel. 

Blog Bonus: Free information sheet summarising the video and the steps - download.


Introduction

When working in a lab and running an agarose gel, you may need to determine the size of the DNA fragment, and this information may be crucial for various biological research applications. 

This approach is also described in the following video:


Setting Up the Experiment

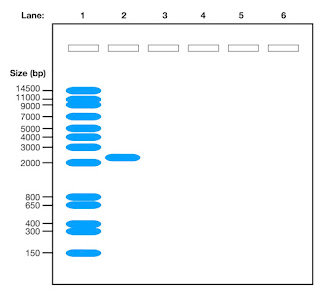
Imagine you have loaded a DNA ladder with known sizes in one lane and your DNA sample with an unknown size in another lane of the gel and you get a result that looks like this when the gel has been run.

DNA gel showing a DNA ladder and a band

Before you can calculate the size of your DNA band, you must first label the gel and collect data to create a calibration curve.

Data Collection and Analysis

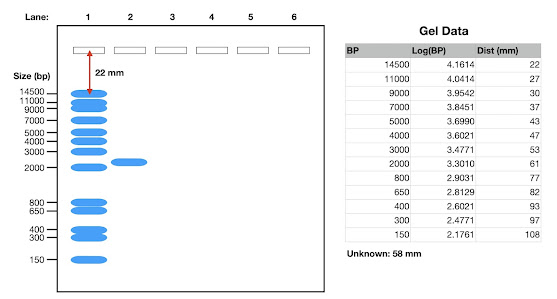
By measuring the distances the DNA bands in the ladder (see below) have moved and plotting the log values of their sizes against the distances travelled in millimetres (or you can do it in pixels), you can create a calibration curve. This curve will help you accurately determine the size of the DNA band in your unknown sample.

The image below shows the gel and the data table for the plot.

Agarose gel showing the DNA ladder and the band of unknown size, plus a table of data constructed from the gel for the grapg

From the table, you plot the calibration curve.

Calibration curve for determining the size of a band on a DNA gel

Calculating the Size of the DNA Band

After plotting the calibration curve (above) and identifying the distance your unknown band has travelled, you can use the curve to determine the size of the DNA band in base pairs. By following a simple formula involving logarithms, you can convert the log value to the actual size in base pairs.

Conclusion

Calculating the size of a DNA band on an agarose gel requires careful data collection, analysis, and interpretation. By following the steps outlined in this guide, you can confidently determine the size of DNA fragments in your samples. 

If you would like to support my blogging efforts, then please feel free to buy me a coffee at https://www.buymeacoffee.com/drnickm

Blog Bonus: Free information sheet summarising the video and the steps - download.

Additional Resources

Wednesday, 1 May 2024

New video posted: DNA Cloning - how to overcome some common problems

In this video, I examine the step-by-step process of cloning DNA into plasmids and address common challenges faced in the lab. I start by preparing the DNA and then move on to using restriction enzymes like EcoRI and HindIII. I explain the importance of choosing the correct enzyme pairs to prevent self-ligation and ensure the correct orientation of the insert. I also cover the blue-white selection method to verify successful cloning and discuss using different vectors for larger DNA segments. 


If you would like to support my blogging efforts, then please feel free to buy me a coffee at https://www.buymeacoffee.com/drnickm

Blog Bonus: Free information sheet summarising the video and defining the key terms - download.
 

Additional Reading

The video was produced with help from the following resources: