Showing posts with label Lab Methods. Show all posts

Thursday 19 September 2024

New Video: Batch vs Continuous Cultures: Growing Cells in the Lab Explained

In this video, I look at Batch and Continuous Cell Cultures and discuss how they can be used in the lab:

In the lab, we often need to grow bacterial, yeast, or mammalian cells, and we use specific methods to cultivate cells in a controlled environment. 

Two common cell growth approaches are batch cultures and continuous cultures.

Batch Cultures: The Standard Approach

If you’ve ever worked in a biology lab, chances are you’re familiar with batch cultures. 

In a batch culture, cells are grown in a fixed space, such as a flask, dish, or plate. The culture is usually incubated for a set period, often overnight or several days, depending on the type of cells you’re growing.

During this process, the cells go through different stages of growth, represented by the bacterial growth curve:

  1. Lag phase: Cells adapt to their environment.
  2. Log phase: Cells rapidly divide and grow.
  3. Stationary phase: Growth slows as nutrients deplete.
  4. Death phase: Cells die as waste products build up and nutrients run out.

One limitation of batch cultures is that you only grow cells for a finite period. When the nutrients in the medium are exhausted, the cells stop growing, and you must start a new batch if you need more cells or products. The number of cells you can produce is limited by space and the number of available nutrients.

Continuous Cultures: Nonstop Cell Growth

In contrast to continuous cultures, cells are grown in a specialised vessel known as a bioreactor, fermentor, or chemostat. 

The continuous culture method continuously adds fresh media to the vessel while an equal amount of media is removed, creating a steady flow. This keeps the cells growing indefinitely, as they are always supplied with fresh nutrients.

One of the primary advantages of continuous cultures is that they maintain cells in the growth phase, meaning they can keep dividing and producing the desired products, whether that’s proteins, enzymes, or other biological compounds. However, setting up a continuous culture can be challenging. If the flow of new media is too slow, cells will run out of nutrients, leading to stagnation and death. But, if the flow is too fast, cells won’t have time to divide, and they could be washed out of the vessel.

The challenge with a continuous culture is finding the right balance in the media flow. The goal is to keep the cells in a state of constant division while also maintaining the product yield. Achieving this balance ensures that the total number of cells in the vessel remains steady over time, which is ideal for industrial applications where continuous production is required.

Choosing the Right Method

When deciding between batch and continuous cultures, the choice depends on the specific requirements of the experiment or production process. Batch cultures are easier to set up and control, making them ideal for smaller-scale studies or experiments with a defined endpoint. Continuous cultures are more complex but offer the advantage of sustained growth and production, which is essential for large-scale manufacturing or long-term studies.

Additional Resources


New Video: Tagging and Labelling Proteins for Purification and Tracking

In this video - Tagging and Labelling Proteins for Purification and Tracking - I look at why we tag proteins and the methods we use to add a tag to a protein.

The Basics of Protein Tagging and Purification: A Lab Guide

During my career, I have had to produce and purify proteins in the lab, which can be challenging.

In the lab, we tag and purify proteins to understand what a protein does in the cell: how it works, is transported and what it interacts with, and to produce proteins for medical treatments. However, working with proteins in the lab presents some challenges. One of the biggest obstacles is that the cells that produce the protein of interest, they also make their own proteins for survival. So, how do we isolate our desired protein from the rest? The answer lies in tagging and labelling techniques, allowing easier purification and tracking.

Why Tag or Label a Protein?

When we express a protein in cells, whether for research or therapeutic purposes, it’s mixed with the cell’s proteins. Hence, we need to purify our protein of interest from this mix, and that's where tagging comes into play. Adding a specific "tag" to the protein allows us to separate it from other cellular proteins using specialised methods. 

Challenges in Protein Production

Another hurdle is that producing a large amount of protein burdens the cell, slowing its growth and division. To counteract this, we use a controlled system to regulate protein production. A common approach in bacterial systems is to use an expression vector that includes regulatory elements, such as the lac operon. Therefore, by adding a chemical called IPTG, we can switch on protein production at the right time once the cells have grown to the desired number.

Methods for Protein Tagging

When it comes to purification, two main protein tags are commonly used:

  1. Histag: This tag consists of a sequence of six or more histidine residues that can be added to either the N- or C-terminal of the protein. After the cells producing the protein are lysed, the tagged proteins can be captured using nickel affinity chromatography. The histidine residues bind to the nickel, making purifying the protein from the cell mixture easy.
  2. GST Tag (Glutathione S-Transferase): GST is a small protein that can be fused to the target protein. The fusion protein is purified using glutathione beads. One advantage of this method is that an enzyme can later cleave the GST tag, leaving behind the pure target protein.

Alternative Tagging for Visualisation

While GFP (Green Fluorescent Protein) doesn’t assist in purification, it is often used to label proteins for visualisation. GFP is a fluorescent protein derived from jellyfish, and it allows the movement of proteins to be tracked inside living cells under a microscope. Like Histag and GST, GFP tagging involves cloning the gene for GFP alongside the gene for the protein of interest, so both are expressed as a single molecule.

Additional Resources

Thursday 15 August 2024

New Video Posted: Bacterial Transformation: Natural vs. Artificial Methods Explained

In this video - Bacterial Transformation: Natural vs. Artificial Methods Explained - I look at how bacteria can take up DNA from the environment and how we can get bacteria to take up DNA in the lab.


Blog Bonus: Free information sheet summarising the video and defining the key terms - download.

Bacterial transformation is where bacteria take up external DNA, which can lead to genetic changes within the cell. This process can occur naturally or be induced artificially in a laboratory setting. 

Natural Transformation

In natural transformation, bacteria acquire DNA from their surroundings, typically from nearby bacteria that have lysed (broken apart). The free-floating DNA can then be integrated into the bacterial chromosome or replace an existing gene, leading to potential new traits or functions. This ability to naturally take up DNA is a trait of "competent" cells, which possess specific genes that encode the machinery necessary for DNA uptake.

Artificial Transformation 

In a lab, we can induce transformation using artificial methods. Unlike natural transformation, this process requires deliberate manipulation of the bacteria to make them more likely to accept new DNA. First, the bacteria must be made competent so they can take up the DNA. Techniques such as heat shock, electroporation, or polycations are then used to encourage bacteria to take up the DNA. Each method works differently but ultimately serves the same purpose: introducing new genetic material into bacterial cells, enabling researchers to study gene function, produce recombinant proteins, or create genetically modified organisms.

Blog Bonus: Free information sheet summarising the video and defining the key terms - download.

Additional Reading

The video was produced with help from the following resources:

Friday 3 May 2024

New video posted: Understanding Nucleic Acid Hybridisation: Methods & Applications Explained

In this video, I look at Nucleic Acid Hybridisation and how it is the underlying principle for several lab techniques, such as PCR (Polymerase Chain Reaction), dot blots, colony blot hybridisation, chromosome in situ hybridisation (FISH), microarrays, Southern and Northern blotting, and CRISPR/Cas9 gene editing.

If you would like to support my blogging efforts, then please feel free to buy me a coffee at https://www.buymeacoffee.com/drnickm

Blog Bonus: Free information sheet summarising the video and defining the key terms - download.
 

Additional Reading

The video was produced with help from the following resources:

A Comprehensive Guide on How to Calculate the Size of a DNA Band on a Gel

How do scientists determine the size of DNA bands on an agarose gel? In this guide, I will walk you through the step-by-step process of calculating the size in base pairs of a DNA band on an agarose gel. 

Blog Bonus: Free information sheet summarising the video and the steps - download.


Introduction

When working in a lab and running an agarose gel, you may need to determine the size of the DNA fragment, and this information may be crucial for various biological research applications. 

This approach is also described in the following video:


Setting Up the Experiment

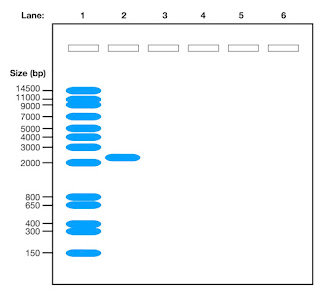
Imagine you have loaded a DNA ladder with known sizes in one lane and your DNA sample with an unknown size in another lane of the gel and you get a result that looks like this when the gel has been run.

DNA gel showing a DNA ladder and a band

Before you can calculate the size of your DNA band, you must first label the gel and collect data to create a calibration curve.

Data Collection and Analysis

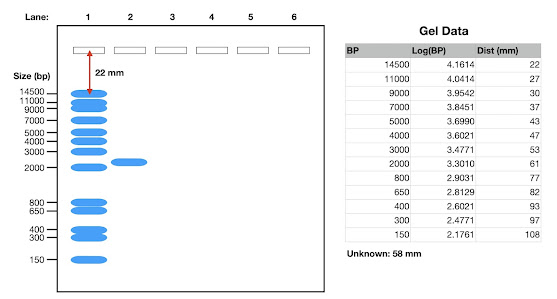
By measuring the distances the DNA bands in the ladder (see below) have moved and plotting the log values of their sizes against the distances travelled in millimetres (or you can do it in pixels), you can create a calibration curve. This curve will help you accurately determine the size of the DNA band in your unknown sample.

The image below shows the gel and the data table for the plot.

Agarose gel showing the DNA ladder and the band of unknown size, plus a table of data constructed from the gel for the grapg

From the table, you plot the calibration curve.

Calibration curve for determining the size of a band on a DNA gel

Calculating the Size of the DNA Band

After plotting the calibration curve (above) and identifying the distance your unknown band has travelled, you can use the curve to determine the size of the DNA band in base pairs. By following a simple formula involving logarithms, you can convert the log value to the actual size in base pairs.

Conclusion

Calculating the size of a DNA band on an agarose gel requires careful data collection, analysis, and interpretation. By following the steps outlined in this guide, you can confidently determine the size of DNA fragments in your samples. 

If you would like to support my blogging efforts, then please feel free to buy me a coffee at https://www.buymeacoffee.com/drnickm

Blog Bonus: Free information sheet summarising the video and the steps - download.

Additional Resources